A Comparison of Javascript Graph / Network Visualisation Libraries
We evaluated 8 different graph visualisation packages in areas spanning performance, algorithms and components
Cylynx
March 09, 2021 · 6 min read
We evaluated 8 different graph visualisation packages in areas spanning performance, algorithms and components
Cylynx
March 09, 2021 · 6 min read
Graph / Network visualisation is a subcategory within the data visualisation space that has grown in popularity over the past few years. There have been emerging use cases to use graphs to understand IOT, social network or transaction data. The growth in the graph database ecosystem has also resulted in a better understanding of the benefits of a graph data representation.
As part of the development of Motif, our graph intelligence software, we evaluated a range of network visualisation solutions to see which tool best fits our use case. In this article, we document our findings on the state of Javascript graph visualisation libraries. This covers both open source and paid libraries. We hope this will be a useful guide for product owners or developers looking to integrate graph visualisation into their application.
While graph visualisation libraries are often used for diagrammatic drawings such as UML diagrams or mind maps, those areas are out of our focus. Here, we are looking to evaluate libraries for data exploration and investigation.
There are many other graph visualisation libraries available including popular desktop applications like Gephi or Cytoscape, and libraries coupled with programming languages like visualisation packages within igraph and networkx. These software libraries are good for an individual analyst but are hard to integrate into larger product offerings.
Javascript with its universal browser support is an extremely attractive solution to build an interactive web application. These libraries could easily be integrated into a larger web application or even published as a desktop electron application. While performance might be poorer than native operating systems capabilities, they are more than good enough for most data visualisation needs.
Here’s the list of 8 libraries we shortlisted for our evaluation:
We identified 3 areas where we are interested in comparing across the different products: performance / rendering engine, algorithms available and out of the box components.
The factor that has the greatest impact on performance is the rendering engine which the underlying framework uses. Yworks, a diagrammatic library SDK provider, has a nice comparison of the 3 rendering methods. Using a 2015 macbook, SVG performance tops gives workable performance until it reaches 2k nodes and 2k edges. Canvas performance reaches the limit at 5k nodes and 5k edges while WebGL is usable until 10k nodes and 11k edges.
While WebGL is more performant as it leverages the GPU processing power of a machine, it is also harder to work with, which means there tends to be a tradeoff between performance, ease of use and capabilities.
This refers to the set of available APIs to allow a user to perform a graph operation. This could include layout options, pathfinding algorithms or even network detection algorithms. All these additional functionalities would significantly cut down on the development time required.
Out of the box components that would speed up product development. This could include a time bar filter or a minimap to help a user navigate through the canvas.
| Library | Licence | Rendering Engine | Algorithms | Components |
|---|---|---|---|---|
| D3 | BSD | SVG / Canvas | Low | Low |
| Keylines | Commercial | Canvas / WebGL | High | Medium |
| Vis.js | MIT | Canvas | Middle | Low |
| Sigma.js | MIT | Canvas / WebGL | Middle | Low |
| Ogma | Commercial | Canvas / WebGL | High | Low |
| G6 | MIT | Canvas | High | High |
| Ngraph | MIT | WebGL | Middle | Low |
| React-force-graph | MIT | WebGL | Low | Low |
In this section, we go into the individual products in detail and our general experience with them (when applicable).
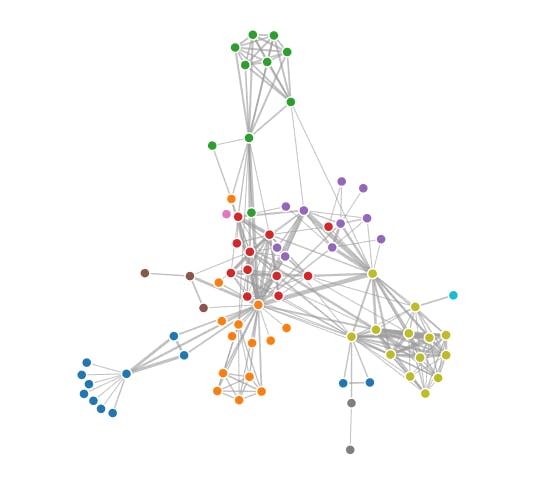
D3 is a full-blown data visualisation framework and one of the most popular choices to make interactive bar charts, line charts, geospatial plots and yes, network plots. However, the amount of time needed to build up a graph visualisation solution to match the capabilities of keylines or G6 is massive.
It contains other helper libraries such as D3-force, but most of the other primitives have to be implemented by the user. Here’s a sample example of using D3 to visualise the Les Mis graph.
There are other wrapper libraries like react-vis-force and react-d3-graph but the former is no longer maintained and the later still has a lot of room to cover to catch up with the other libraries.

Keylines and its React sister library Regraph is a commercial product by cambridge intelligence with a powerful visualisation engine that supports canvas and WebGL rendering.
Of all the libraries we tried, we think keylines is the most performant, even comparing across other WebGL libraries. It has out of the box support for most many graph algorithms, has multiple useful layouts and comes with components such as a time bar for easy integration.
Pros:
Cons:
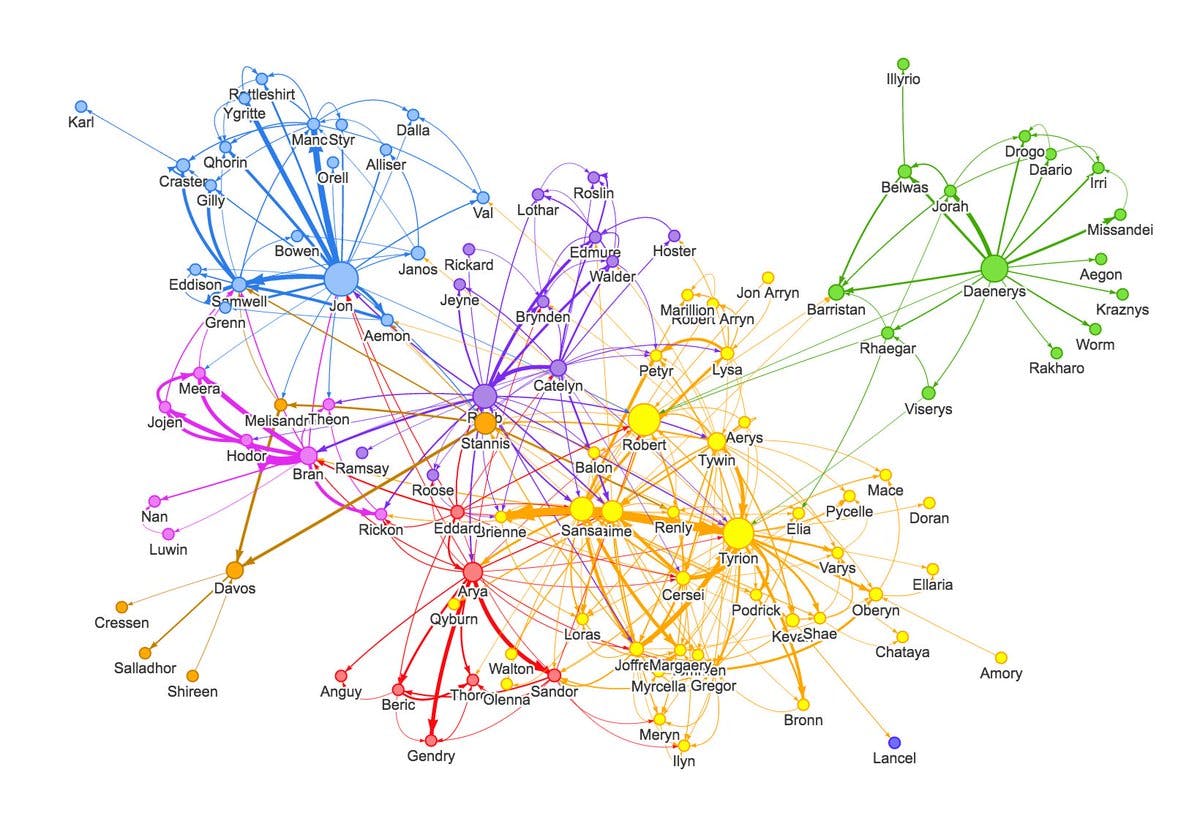
Vis-network is a relatively performant open-source canvas library. It has out of the box support for clustering, layout, simple graph manipulation and events. As one of the first libraries we tried, we think it works well for a simple graph visualisation task but is relatively hard to extend and build on.
Pros:
Cons:

This is another long-standing and popular library in the network visualisation space. While version 1.x has not been updated in a long time, a new version, sigma 2.0 is in the works and has been in beta release 2018 and is still in active development. This splits the graph data structure which is now managed by a library called graphology with the render layer which is handled by sigma js.
Unfortunately, that is not too well documented and our existing evaluation is based on Sigma.js 1.x.
Pros:
Cons:
Note: This section is based on the documentation available and not based on an actual trial. Ogma by Linkurious is a relatively new commercial visualisation software that contains numerous features to display, explore and build interactive graph applications. It is the underlying library used by the Linkurious software which was supposedly forked from Sigma js and further maintained and developed.
Pros:
Cons:
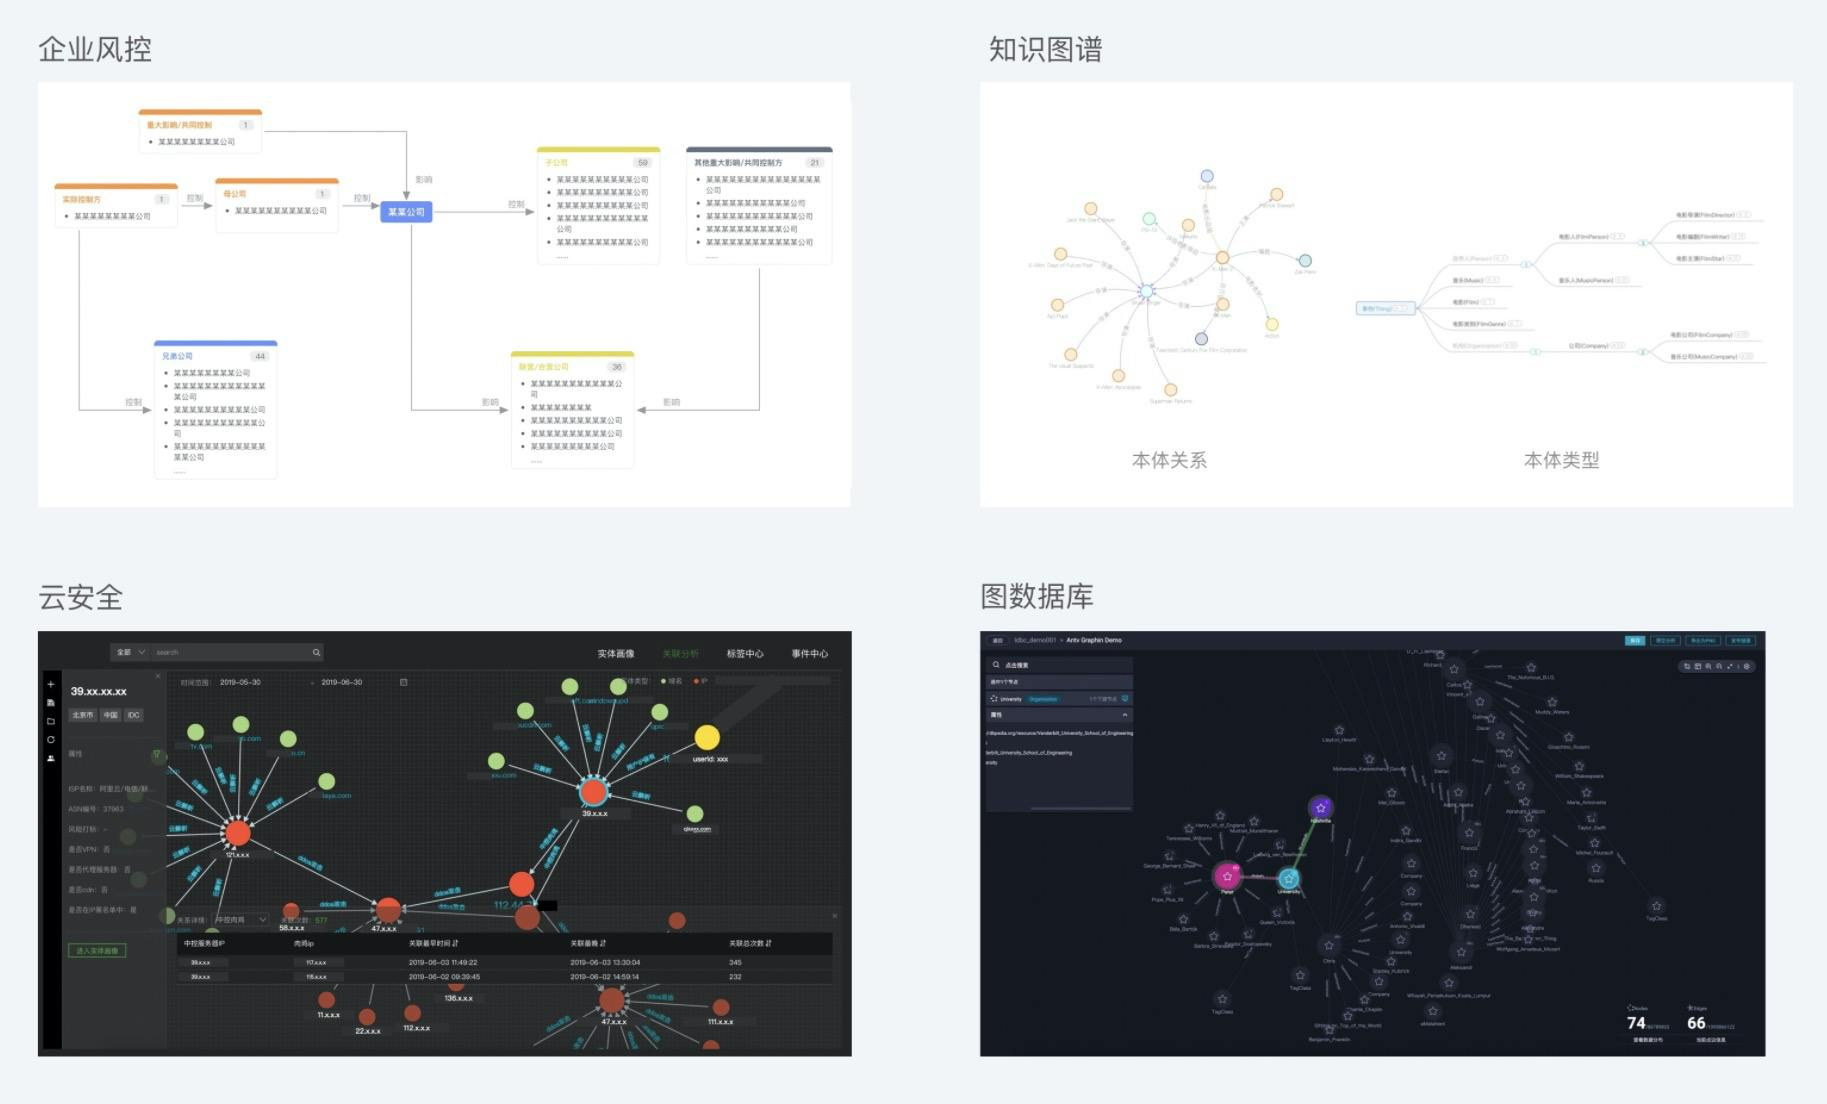
G6 and its sister library Graphin are products by the Ant Visualisation team. While G6 provides canvas-based graph visualization framework with numerous algorithms and styling functions, Graphin integrates it with React and provides additional components that can be used with the library.
If you are looking to visualise a small to moderate graph size, both libraries should contain enough tools and capabilities to help a developer quickly build up an application quickly.
Pros:
Cons:
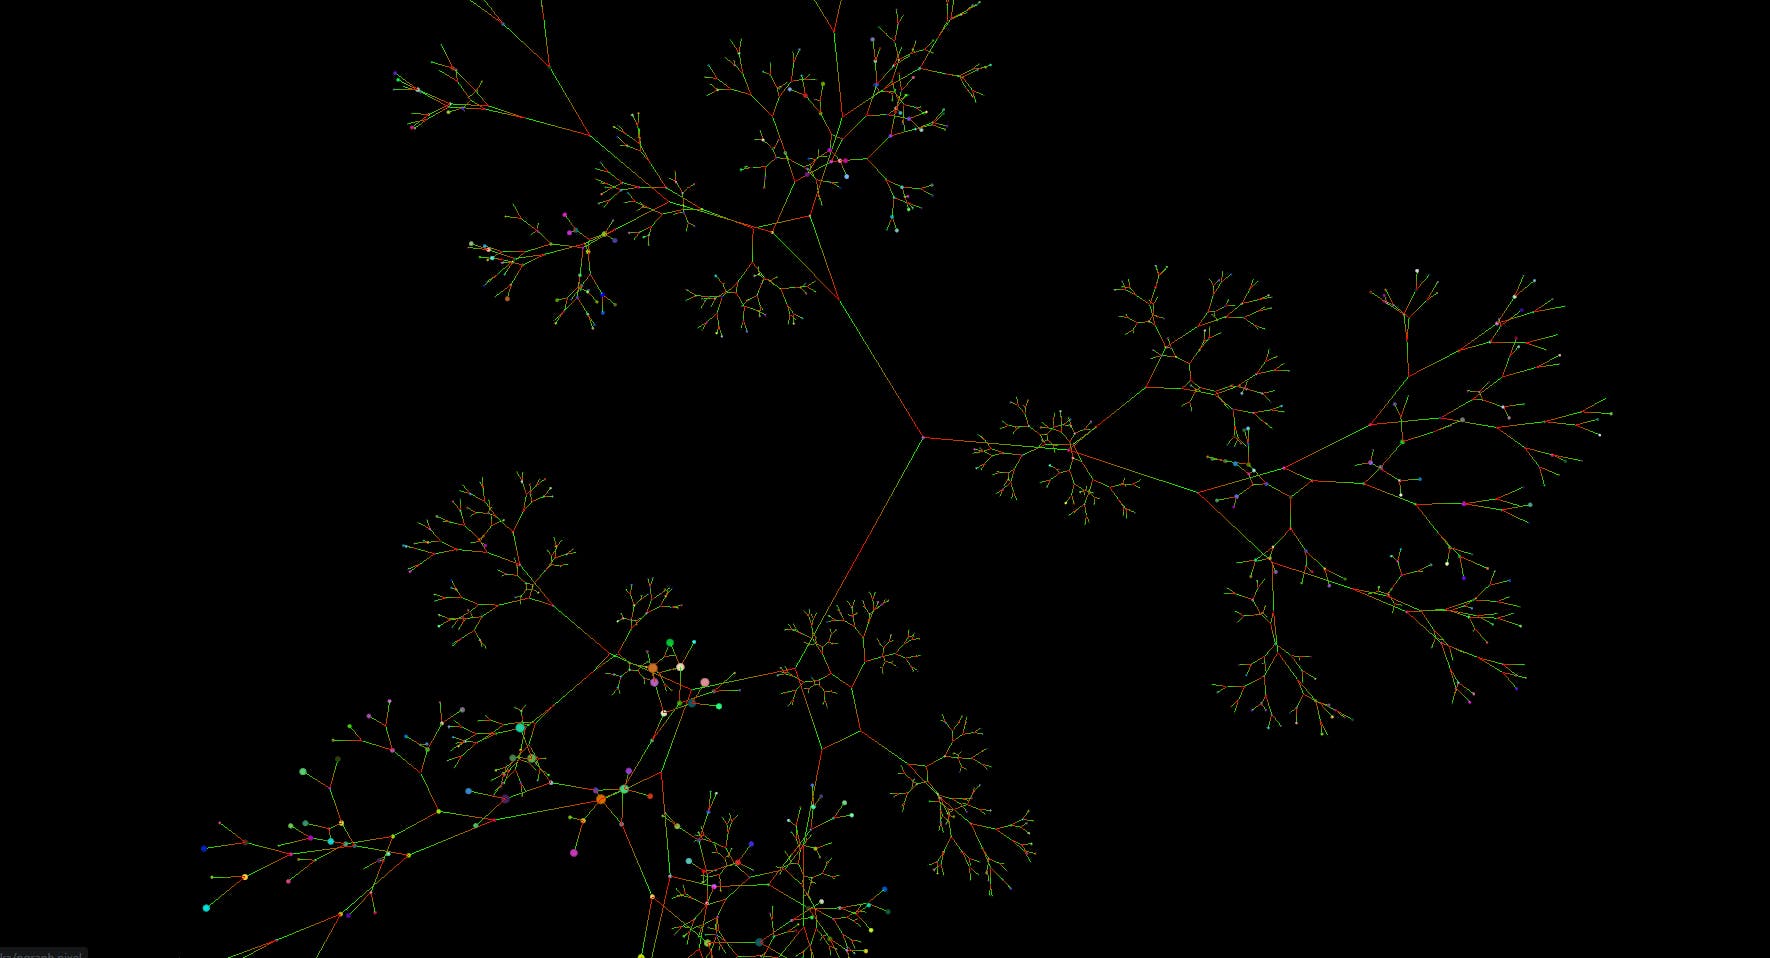 Andrei Kashcha the author of the libraries has numerous other libraries which are worth a look for any graph enthusiast. The main ones in the ecosystem would be ngraph, the library for graph data structure, VivaGraph, an opinionated set of graph drawing modules on top of ngraph and other algorithm packages.
He has numerous examples which show how to render ngraph in other webGL rendering libraries such as PIXI.js and three.js. While this means potentially lots of flexibility for a developer, it also means a lot of work is required to build up the necessary business functionalities.
Pros:
Cons:
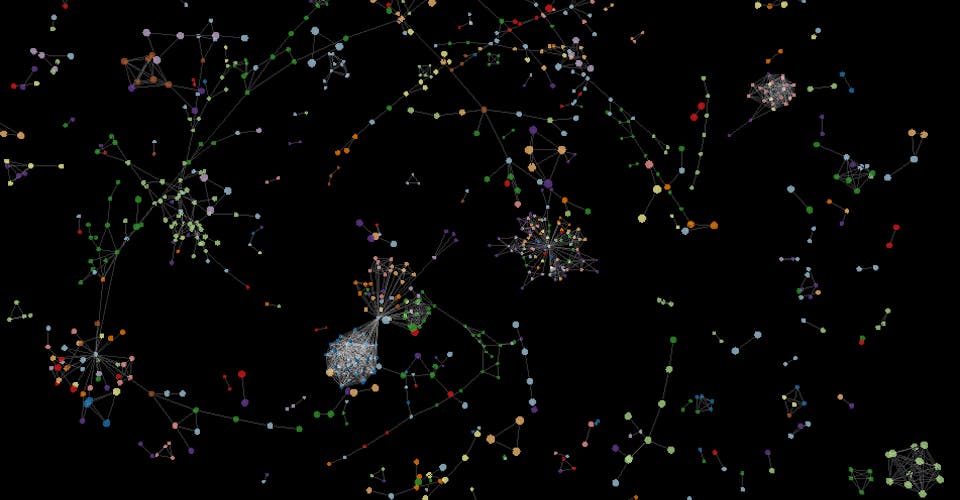
This is a collection of graph visualisation libraries which includes a 2D canvas library, a 3D WebGL three.js based library and even a VR based library. Performance seems to be excellent as well from the demos with a reasonably comprehensive set of styling options. One limitation is that they all support only force-directed layout out of the box, with no time series or geospatial support.
Pros:
Cons:
In this post, we compared 8 different graph visualisation libraries and their pros and cons. As evident, it’s hard to say any solution is the best in the market currently and it really depends on one’s budget, knowledge of javascript or WebGL and need for other algorithms and components.
We eventually decided to implement G6 and Graphin into our product as we felt that they provide a good balance of reasonable performance, with a rich set of features and high customizability. It is in active development as well, with plans to support WebGL rendering in the future, so that would bring it on-par performance-wise with the other libraries.
If we were a large financial institution with plenty of cash and not planning on commercialising the product, Keylines would be an attractive option with its top-notch library, documentation and support. For a hobbyist exploring the network visualisation space, I would definitely try out ngraph or react-force-graph, especially if more detailed styling or event management is not needed.
We still see a huge space to make graph analysis easier, not only on the front-end application side but also in terms of wider integration with enterprise systems, and better support for sharing and collaboration. Hence, we are building Motif to fill that gap and be the business intelligence tool for graphs. Check it out and register to receive the latest updates.